unofficial timeline of events
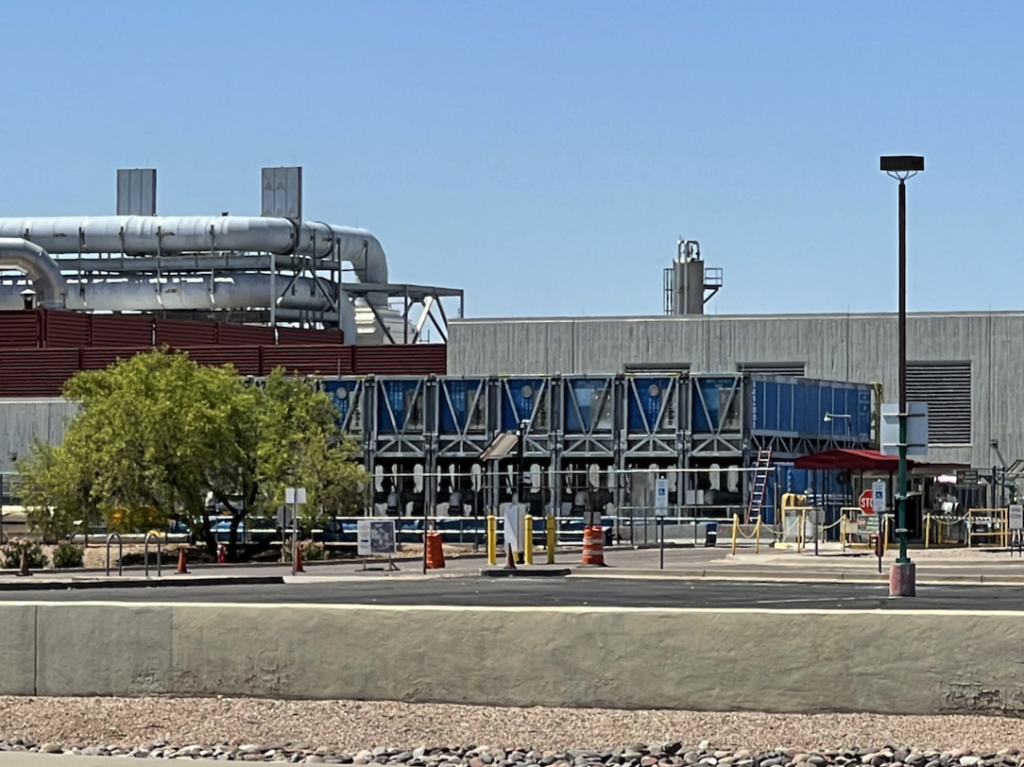
Intel begins operations of the temporary cooling towers on the east side of the Chandler campus located near Rural Rd and Chandler Blvd
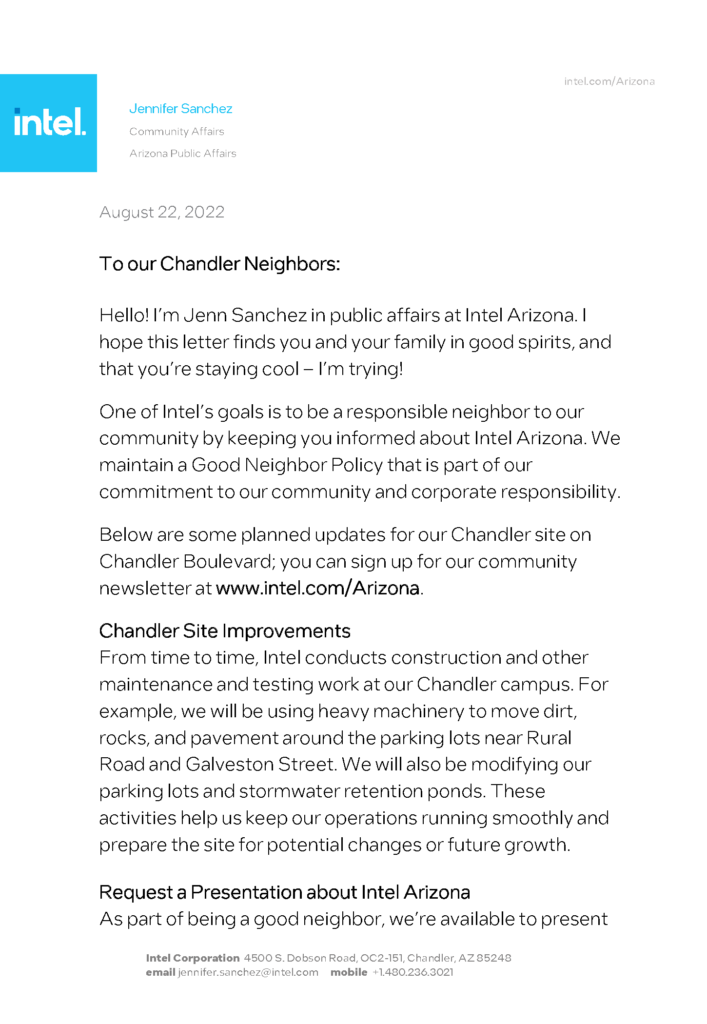
A day after operations begin, Intel public relations leaves door flyers.
Unacceptable noise continues
Noise complaint filed with City of Chandler via iOS PublicStuff App
Contacted J. Sanchez lodging noise complaint and seeking information.
Decible X iOS App
HOA contacted and asked to reach out to neighbors, HOAs, Intel, and the City to address issue.
Non-emergency contact
Email to City Council and Staff to review and address issue.
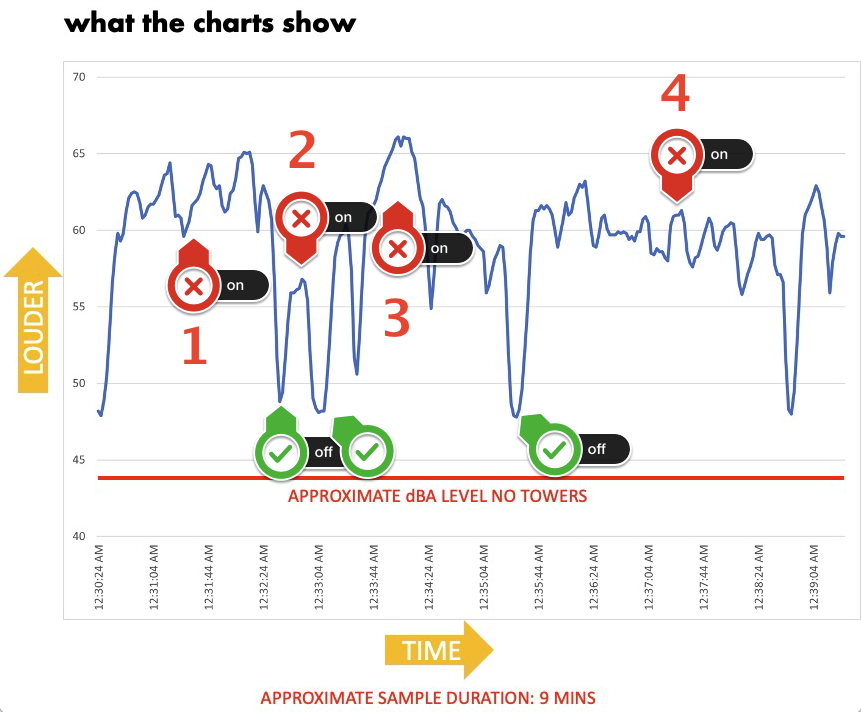
these charts reflect information from a data logging sound level meter. The intent is to show that the cooling towers from Intel cycle at an impossible-to-ignore rate at volume levels well above that of what the neighborhoods experienced before.
red Xs are when the units are on, green checks when off.
time in mins and seconds (mm:ss)
begin sample
- Cycle 1 - 2:04 mins on
- Off - 0:02 mins
- Cycle 2 - 0:18 mins on
- Off - 0:10 mins
- Cycle 3 - 2:10 mins on
- Off - 0:08 mins
- Cycle 4 - 3:10 mins on
- Cycle 1 - 2:04 mins on
end of sample
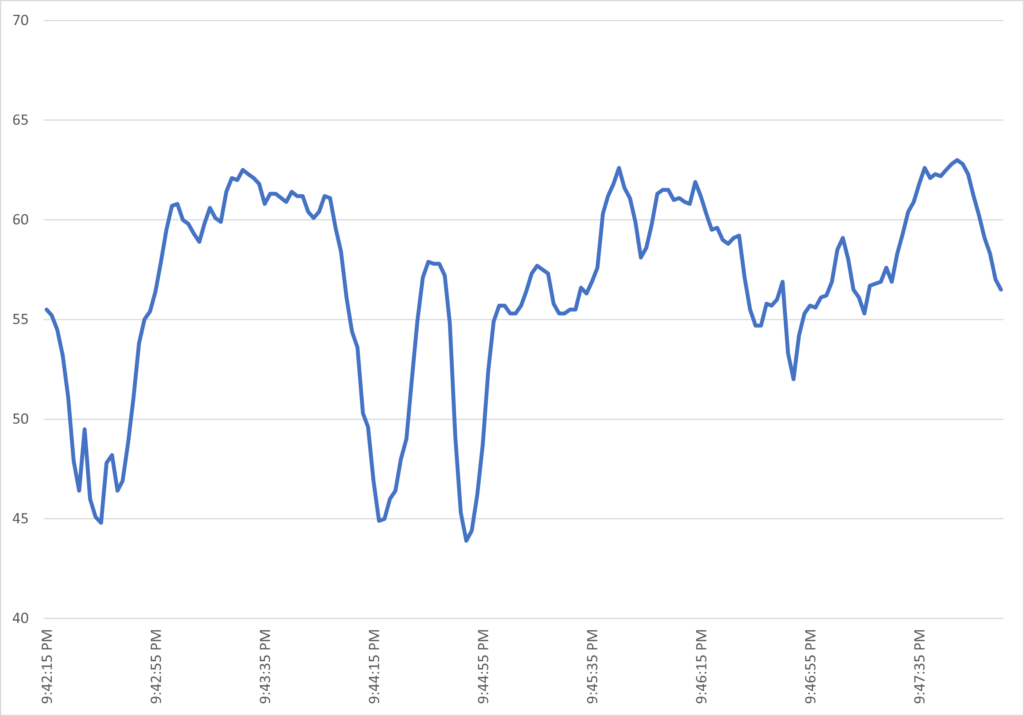
Avg.:56.7
Maximum:63.0@9/4/2022 9:47:49 PM
Minimum:43.9@9/4/2022 9:44:49 PM
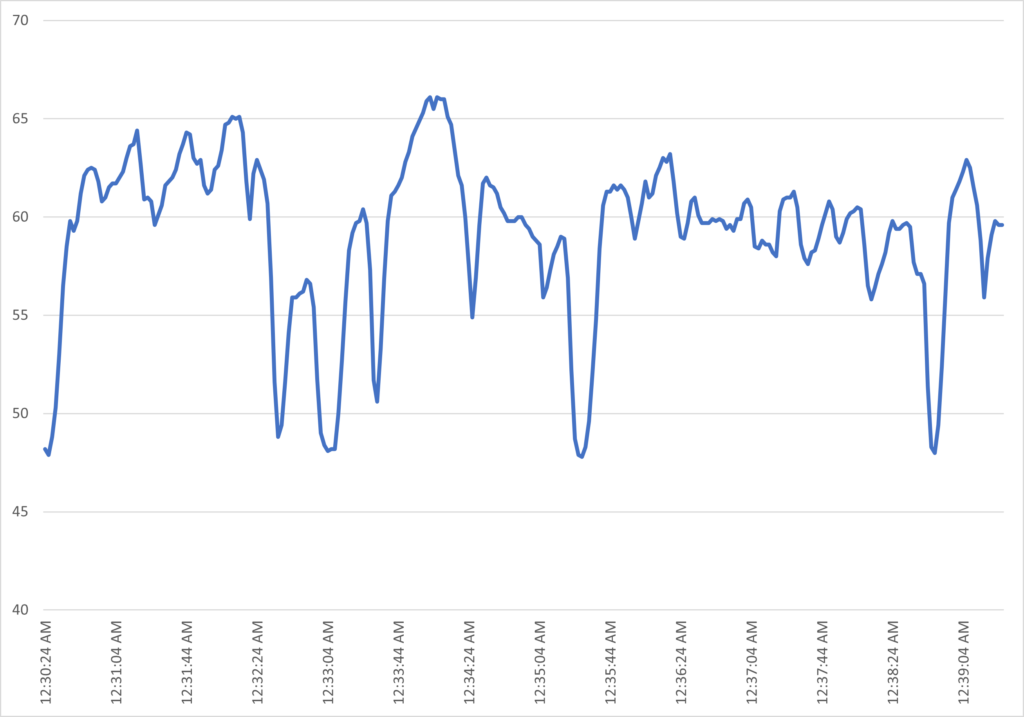
Avg.:59.2
Maximum:66.1@9/5/2022 12:34:02 AM
Minimum:47.8@9/5/2022 12:35:28 AM
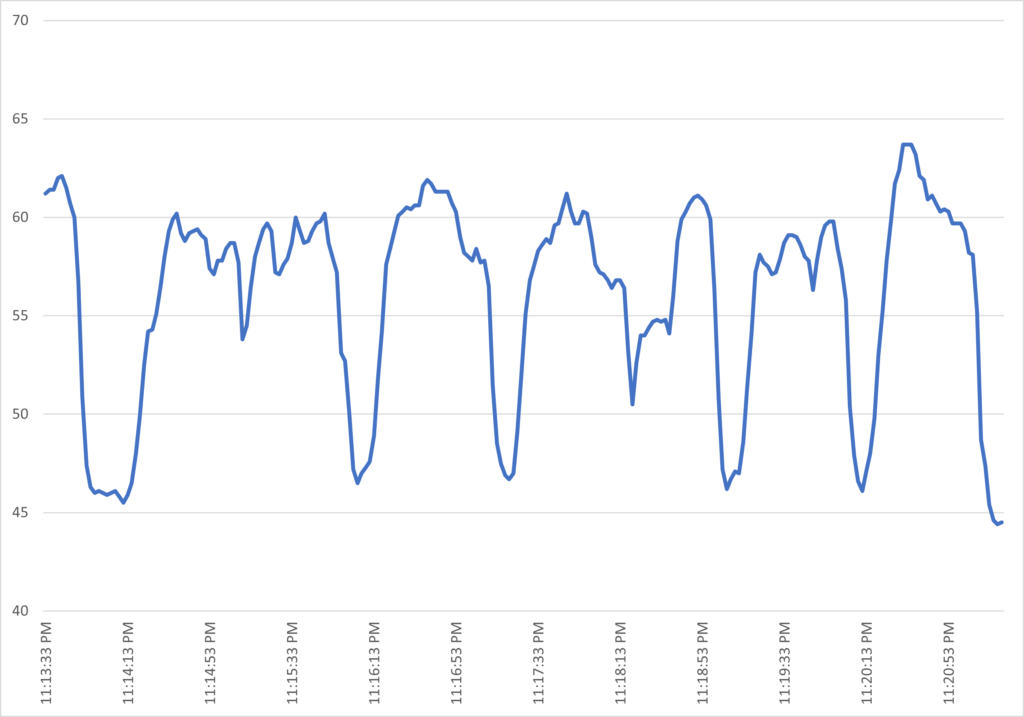
Avg.:57.6
Maximum:63.2@9/6/2022 11:32:23 PM
Minimum:44.4@9/6/2022 11:31:53 PM
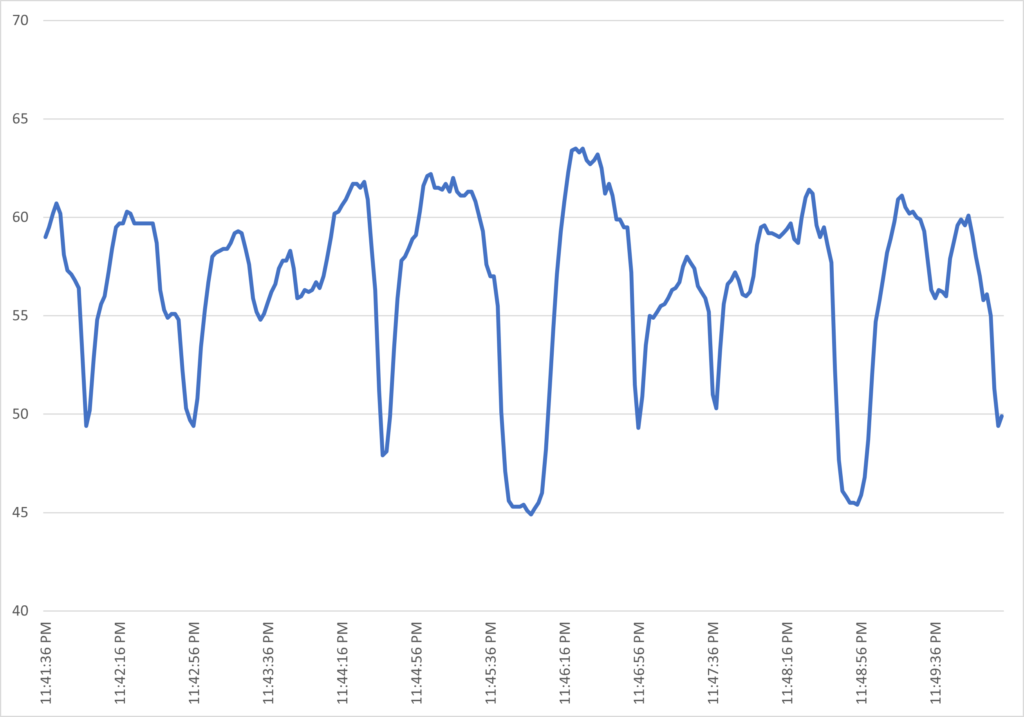
Avg.:56.7
Maximum:63.5@9/7/2022 11:46:22 PM
Minimum:44.9@9/7/2022 11:45:58 PM
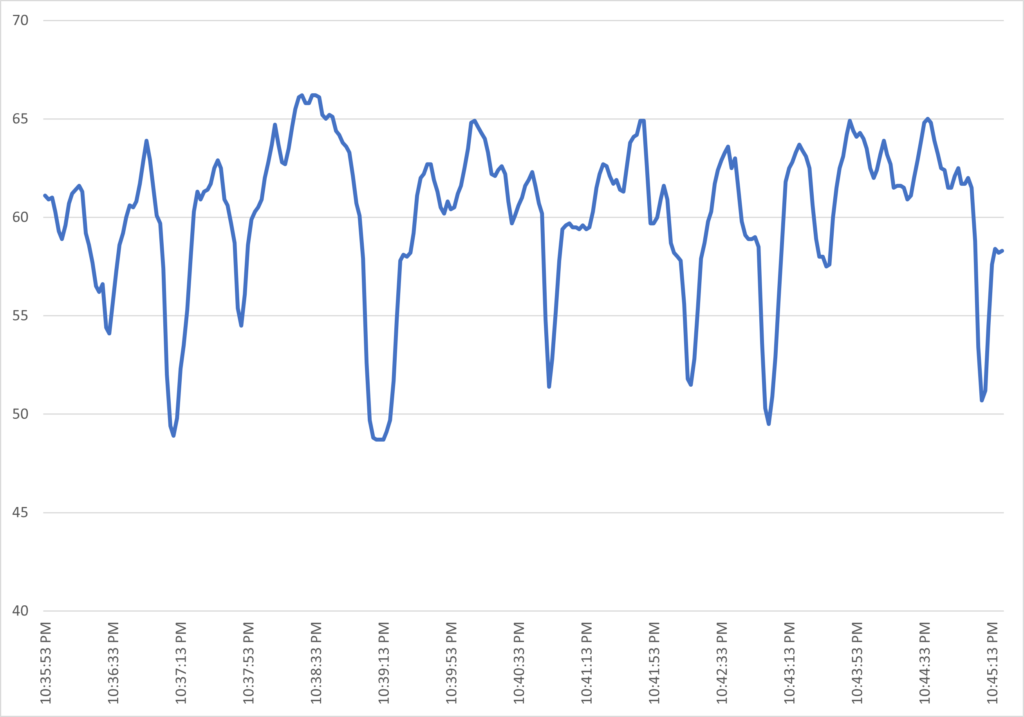
Avg.:60.2
Maximum:66.2@9/8/2022 10:38:21 PM
Minimum:48.7@9/8/2022 10:39:09 PM
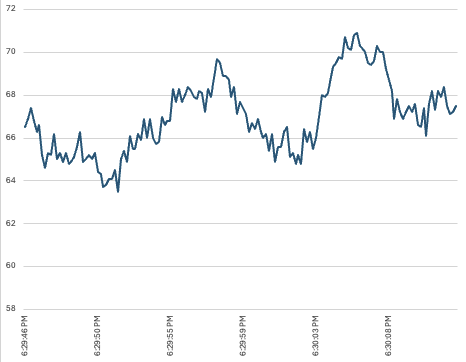
Avg.:67.0
Maximum:70.9!!!
Minimum:63.5
